After completing this lesson, you’ll be able to:
Safe Software is an all-data integration solution company that helps organizations bring life to their data with FME, the only no-code Enterprise Integration Platform with comprehensive support for spatial data. With almost 30 years of expertise and 25,000+ enterprise customers across 125+ countries, whatever your data challenge is, we can help you.
The FME Platform has built-in support for thousands of systems as well as 800+ out-of-the-box transformers allowing users to build and automate custom integration workflows without having to code. Whether your data challenges have to do with spatial data, big data, stream processing, cloud migration, or business intelligence, FME is here to help you spend more time using data, and less time fighting it.
You will learn the FME essentials throughout this learning path by completing hands-on problem-solving exercises. You will learn how FME helps you integrate data through three phases:
By the end of the learning path, you will be ready to create your own FME data integration workflows.
Data integration helps address the following challenges faced by many organizations:
Data silo: data or databases that are maintained and used outside organization-wide data administration. Often they are associated with a single individual or department.
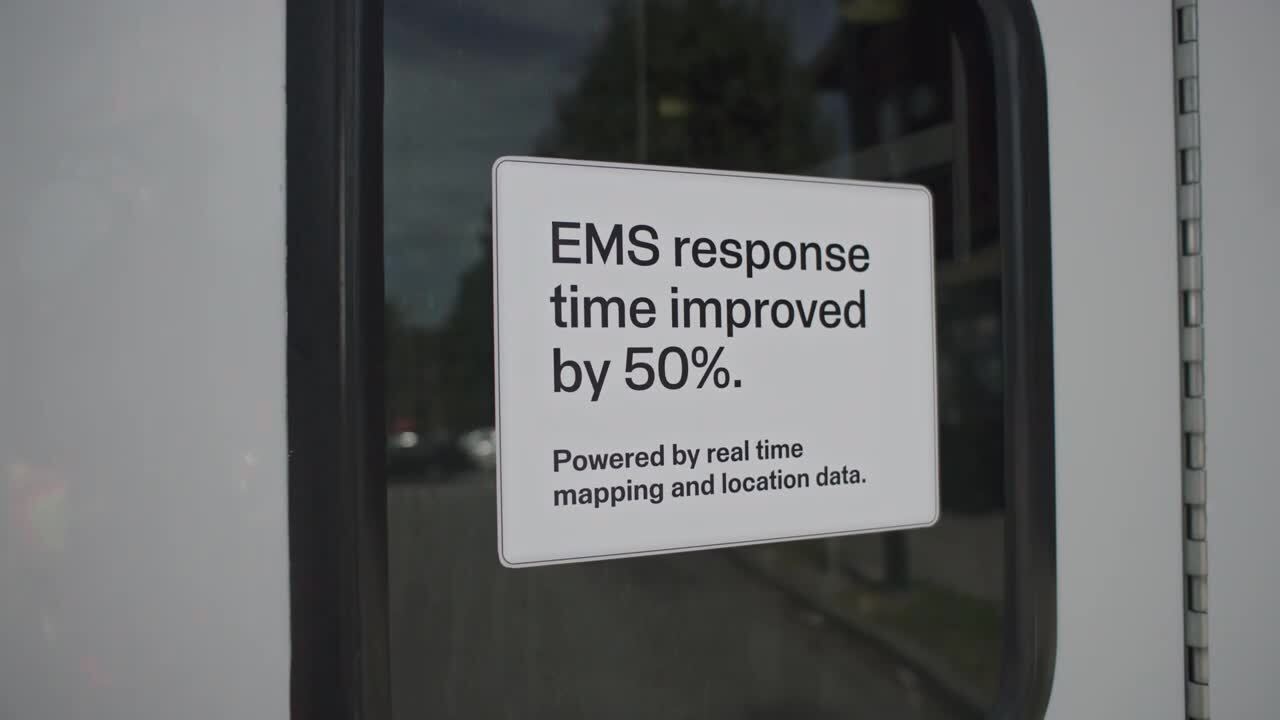
The City of Naperville, Illinois, automated 3300+ service requests and work orders in their first year using FME. They used FME to break down data silos across their Electric, Public Works, Finance, and Water departments while delivering more with less staff. They use FME to integrate several technologies, including:
Danielle DuBose, Database Developer in Naperville’s IT department, says, “Our customer experience has improved, and we have reduced department frustration through upgrading business processes with FME. It’s been a game changer for us."
Removing data silos through data integration can:
To many, 'spatial data' translates directly to 'map.' Maps are a great way to display spatial data, but there is much more to spatial data than just maps. After all, everything we see and do has some spatial component. Where we live, how we travel - the list doesn’t end.
We can learn more about why certain spatial relationships exist by analyzing spatial data and how certain variables impact our lives. Why are specific locations popular travel destinations? Why does a brand succeed in one country and not another? It’s time to start adopting spatial and location data practices better to understand human behavior and our influence on the planet.
More and more organizations are producing and using spatial data. However, getting value out of that data through automating business processes and analyzing spatial patterns requires spatial data integration. Many data integration platforms exist, but FME provides the best support for spatial data integration.
Spatial data: data that is representative of a specific geographic location on the surface of the Earth.
Spatial data is often used with a geographic information system (GIS), a system designed to capture, store, manipulate, analyze, manage, and present all types of spatial data.
If you are already familiar with spatial data, you can skip ahead to the Quiz.
Most of the workflows shown on the FME Academy use spatial data. If you don't work with spatial data, you might prefer to take some introductory training that uses other data types:
Working with Table/Tabular Data
Once you've taken these, you can come back to the FME Academy to learn more advanced techniques.
Spatial data can be stored in vector or raster formats. Vector spatial data is made up of points, lines, and polygons. At its core, it consists of lists of coordinates on a plane and information regarding how they are connected.
Raster data comprises pixels, where the value (or color) of a pixel represents the value of a phenomenon, e.g., the average annual precipitation. Standard imagery uses the visible spectrum like a regular photograph. However, other kinds of imagery are available. For example, imagery in the near-infrared band can be used to measure the prevalence of vegetation beyond what the human eye can detect.
Raster data is better for representing continuous data that varies over an entire area, such as elevation. Vector data is better for representing discrete objects, such as the outlines of buildings (polygons).
| Geometry type | Illustration | Examples |
| Point |  |
Cell towers Community centers Fire hydrants Oil wells |
| Line |  |
Electricity distribution network Pipelines Roads Trails Water distribution network |
| Polygon |  |
Administrative borders Building footprints Service areas Water bodies Zoning districts |
| Raster |  |
Classified land use Elevation Orthophoto (a satellite or aerial photograph adjusted so the scale is uniform) Scanned documents |
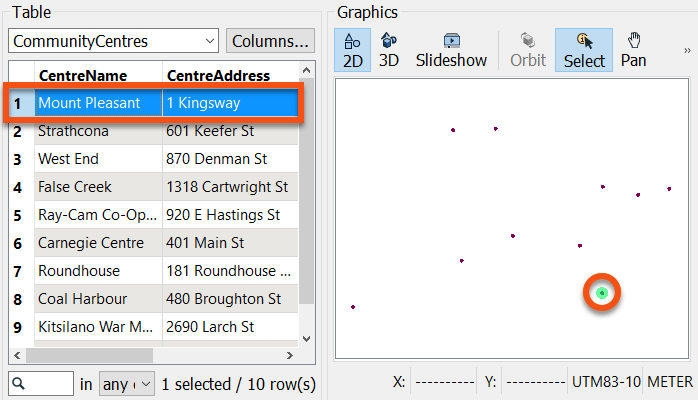
Spatial data contains geometry data that describes the actual location of the data. It also usually includes attribute data that describes the features. For example, here is a dataset of point locations of community centers that includes attributes such as “CentreName” and “CentreAddress.”
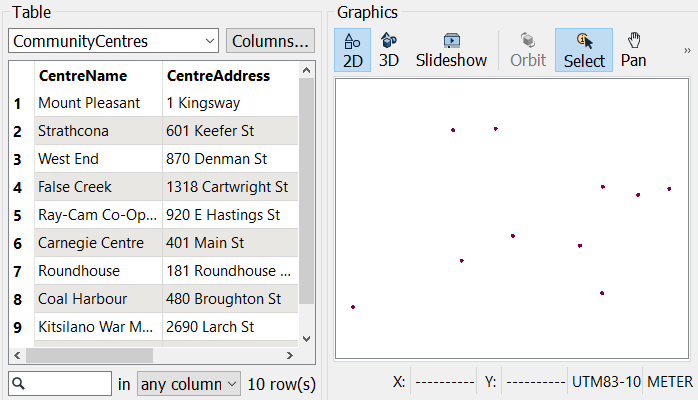
Having geometry and attributes in the same dataset lets you query or filter the data. For example, you could filter the dataset of community centers to select the point with a “CentreName” that equals “Mount Pleasant.”
You can create maps or analyze patterns like clusters using spatial data. However, you must integrate it with other data sources to gain maximum value. For example, retail businesses combine existing store locations, road networks, and neighborhood demographic data to identify the best place to build new stores.
Integrating spatial with nonspatial data, such as spreadsheets or database tables, is also possible. This integration is possible if the nonspatial data has an attribute with spatial information. Many nonspatial datasets contain addresses, coordinates, or other identifiers. Combining these with spatial data allows you to unlock new insights. For example, retail businesses combine customer transaction data (containing their zip or postal code) with neighborhood demographic data to understand their customers and market their products or services more effectively.
After completing this lesson, you’ll be able to:
Safe Software is an all-data integration solution company that helps organizations bring life to their data with FME, the only no-code Enterprise Integration Platform with comprehensive support for spatial data. With almost 30 years of expertise and 25,000+ enterprise customers across 125+ countries, whatever your data challenge is, we can help you.
The FME Platform has built-in support for thousands of systems as well as 800+ out-of-the-box transformers allowing users to build and automate custom integration workflows without having to code. Whether your data challenges have to do with spatial data, big data, stream processing, cloud migration, or business intelligence, FME is here to help you spend more time using data, and less time fighting it.
You will learn the FME essentials throughout this learning path by completing hands-on problem-solving exercises. You will learn how FME helps you integrate data through three phases:
By the end of the learning path, you will be ready to create your own FME data integration workflows.
Data integration helps address the following challenges faced by many organizations:
Data silo: data or databases that are maintained and used outside organization-wide data administration. Often they are associated with a single individual or department.
The City of Naperville, Illinois, automated 3300+ service requests and work orders in their first year using FME. They used FME to break down data silos across their Electric, Public Works, Finance, and Water departments while delivering more with less staff. They use FME to integrate several technologies, including:
Danielle DuBose, Database Developer in Naperville’s IT department, says, “Our customer experience has improved, and we have reduced department frustration through upgrading business processes with FME. It’s been a game changer for us."
Removing data silos through data integration can:
To many, 'spatial data' translates directly to 'map.' Maps are a great way to display spatial data, but there is much more to spatial data than just maps. After all, everything we see and do has some spatial component. Where we live, how we travel - the list doesn’t end.
We can learn more about why certain spatial relationships exist by analyzing spatial data and how certain variables impact our lives. Why are specific locations popular travel destinations? Why does a brand succeed in one country and not another? It’s time to start adopting spatial and location data practices better to understand human behavior and our influence on the planet.
More and more organizations are producing and using spatial data. However, getting value out of that data through automating business processes and analyzing spatial patterns requires spatial data integration. Many data integration platforms exist, but FME provides the best support for spatial data integration.
Spatial data: data that is representative of a specific geographic location on the surface of the Earth.
Spatial data is often used with a geographic information system (GIS), a system designed to capture, store, manipulate, analyze, manage, and present all types of spatial data.
If you are already familiar with spatial data, you can skip ahead to the Quiz.
Most of the workflows shown on the FME Academy use spatial data. If you don't work with spatial data, you might prefer to take some introductory training that uses other data types:
Working with Table/Tabular Data
Once you've taken these, you can come back to the FME Academy to learn more advanced techniques.
Spatial data can be stored in vector or raster formats. Vector spatial data is made up of points, lines, and polygons. At its core, it consists of lists of coordinates on a plane and information regarding how they are connected.
Raster data comprises pixels, where the value (or color) of a pixel represents the value of a phenomenon, e.g., the average annual precipitation. Standard imagery uses the visible spectrum like a regular photograph. However, other kinds of imagery are available. For example, imagery in the near-infrared band can be used to measure the prevalence of vegetation beyond what the human eye can detect.
Raster data is better for representing continuous data that varies over an entire area, such as elevation. Vector data is better for representing discrete objects, such as the outlines of buildings (polygons).
| Geometry type | Illustration | Examples |
| Point | |
Cell towers Community centers Fire hydrants Oil wells |
| Line | |
Electricity distribution network Pipelines Roads Trails Water distribution network |
| Polygon | |
Administrative borders Building footprints Service areas Water bodies Zoning districts |
| Raster | |
Classified land use Elevation Orthophoto (a satellite or aerial photograph adjusted so the scale is uniform) Scanned documents |
Spatial data contains geometry data that describes the actual location of the data. It also usually includes attribute data that describes the features. For example, here is a dataset of point locations of community centers that includes attributes such as “CentreName” and “CentreAddress.”
Having geometry and attributes in the same dataset lets you query or filter the data. For example, you could filter the dataset of community centers to select the point with a “CentreName” that equals “Mount Pleasant.”
You can create maps or analyze patterns like clusters using spatial data. However, you must integrate it with other data sources to gain maximum value. For example, retail businesses combine existing store locations, road networks, and neighborhood demographic data to identify the best place to build new stores.
Integrating spatial with nonspatial data, such as spreadsheets or database tables, is also possible. This integration is possible if the nonspatial data has an attribute with spatial information. Many nonspatial datasets contain addresses, coordinates, or other identifiers. Combining these with spatial data allows you to unlock new insights. For example, retail businesses combine customer transaction data (containing their zip or postal code) with neighborhood demographic data to understand their customers and market their products or services more effectively.
